

methodology & Scope
To pull the necessary data for this research, I compiled market reports & housing data from Redfin & Zillow, paired that with further data and trends from the MLS (North Texas Real Estate Information Systems), then added in Dallas City Appraisal District data for further sales verification and neighborhood context.
I spent about a week bringing all of this information together in spreadsheets and visualizing the information for better clarity. I included all of Dallas' most active neighborhood markets north of the Trinity River.
*Authors Note: The amount of data I still have to sift through is so much that I have decided I will be updating this article regularly as well as providing in depth reviews of each neighborhood as the year goes on. Bookmark this page and check back for more info!
North Dallas Market Overview
When looking at North Dallas as a whole, the numbers average out to be a relatively modest cooling pattern, increasing home prices while increasing listings without a collapse of the sales numbers. While Dallas remains desirable and prices are at new heights, buyer competition has generally softened across the market and days-on-market (DOM) have slowly been increasing.
- On a national scale, DFW has slipped from a top-performing market to mid-tier status, though the month-over-month recovery hints at renewed traction entering 2026.
- While competition has cooled sharply from pandemic-era peaks (as shown by reduced sale-to-list ratios and fewer over-ask sales), the market hasn’t contracted—sales volume is slightly up year-over-year.
- Time on market has increased, pointing to buyer hesitation or price sensitivity.
- North Dallas is still seeing robust price appreciation, especially among higher-end homes, likely due to tight supply and resilient demand in elite submarkets like Preston Hollow and Lakewood.
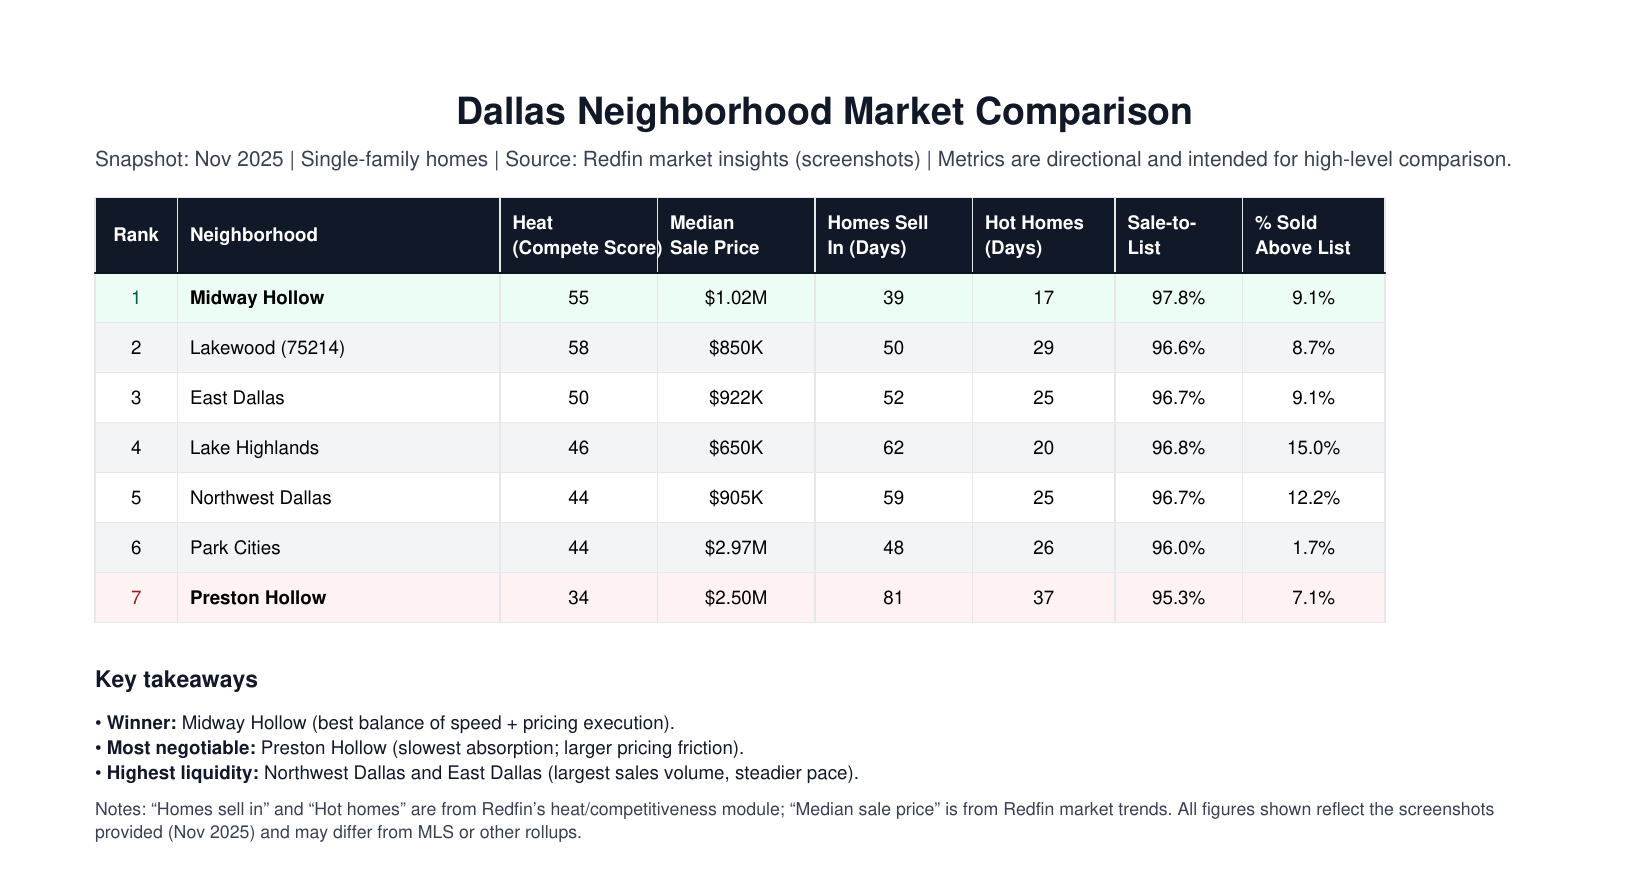
The Biggest Winner
Midway Hollow
Midway Hollow has quickly gone from a quiet secret to one of Dallas’s most in-demand neighborhoods. Just west of Preston Hollow, it offers a mix of charming 1950s cottages and sleek new custom builds, giving the area a unique blend of old and new. The neighborhood has stayed down-to-earth even as prices have climbed, attracting everyone from young families to empty nesters. Over the past few years, the market has been strong; homes move fast, competition stays high, and the area’s popularity shows no signs of slowing down.
Why it wins:
- Fastest absorption among core neighborhoods (36–39 DOM; hot homes ~17 days)
- Improving sale-to-list ratio (97.8%, +2.3 pts YoY)
- Rising over-ask activity (9.1%, +9.1 pts YoY)
- Price point supports sustained buyer depth despite lower volume

Data Summary:
- Market posture: Somewhat competitive
- Median sale price: ~$1.0–$1.025M
- Redfin narrative indicates +5.7% YoY
- short-term pricing volatility rather than structural weakness
- Sale-to-list price ratio: 97.8% (+2.3 pts YoY)
- Homes selling above list: 9.1% (+9.1 pts YoY)
- Median days on market: ~36 days (-19 days YoY)
- Average days to pending: ~36–39 days
- Hot homes: ~17 days, ~1% below list
- Homes sold (Nov): 22 (-12% YoY)
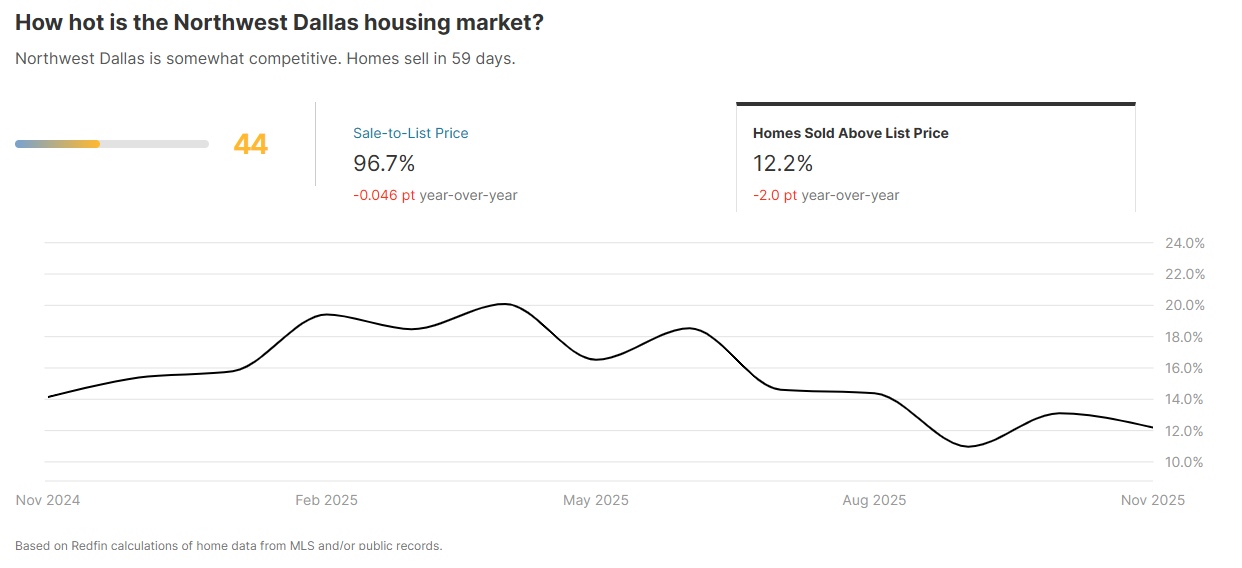
Northwest Dallas
Northwest Dallas covers a broad stretch of classic neighborhoods filled with mid-century homes, big yards, and leafy streets. Commonly known as the “Private School Corridor”, this sprawling area just south of LBJ freeway and west of the Dallas North Tollway offers a plethora of private school options along with a couple others in adjacent neighborhoods. It’s centrally located with quick access to airports, private schools, and city hotspots, which makes it a draw for both families and investors. The area saw huge gains during the early 2020s and has mostly held onto them as it pushes home values westward. With a mix of charm and opportunity, it’s a market that continues to evolve and appreciate albeit increasing inventory.
Strengths
- Highest transaction volume
- Stable absorption (~50–55 DOM)
- Durable buyer base
Limiters
- Softening prices
- Limited appreciation upside
- Execution is steady, not competitive
Data Summary
- Market posture: Somewhat competitive
- Redfin Compete Score: 44
- Median sale price: ~$905K
- Indicates mild but broad-based pricing softening rather than volatility
- Sale-to-list price ratio: 96.7% (essentially flat YoY)
- Homes selling above list: 12.2% (-2.0 pts YoY)
- Median days on market: ~50 days (-3 days YoY)
- Average days to pending: ~54–59 days
- Homes sold (Nov): ~205–224 (-3% to -5% YoY vs previous year month)
- Hot homes: ~25 days, around list price
Lakewood
Lakewood is one of Dallas’s most beloved neighborhoods—set along White Rock Lake, it blends old-school charm with an outdoorsy lifestyle. The streets are lined with character-filled homes, and locals love the friendly, front-porch culture. Over the last few years, demand here has outpaced supply, keeping prices high and the market competitive. Even as things slowed citywide, Lakewood barely flinched. With its scenic setting, strong schools, and limited turnover, it remains a top-tier choice for buyers looking for classic Dallas appeal.
Strengths
- Strong brand demand and consistent liquidity
- Still sees multiple offers on select inventory
Limiters
- DOM rising materially (~51 days, +18 YoY)
- Over-ask activity down sharply
- Momentum cooling faster than Midway Hollow

Data Summary
- Market posture: Somewhat competitive
- Redfin Compete Score: 58
- Median sale price: ~$850K (+1.8% YOY)
- Sale-to-list price ratio: 96.6% (-1.4 pts YoY)
- Homes selling above list: 8.7% (-10.9 pts YoY)
- Median days on market: ~51 days (+18 days YoY)
- Average days to pending: ~50–55 days
- Hot homes: ~29 days, near list price
- Homes sold (Nov): ~103–112 (roughly flat YoY)
East Dallas
East Dallas has always stood out for its mix of charm, character, and eclectic energy. Home to neighborhoods like Junius Heights, Hollywood Heights, and parts of Old East Dallas, the area blends historic architecture with a creative, community-driven vibe. It’s where Craftsman bungalows sit under mature trees, neighbors gather at local coffee shops, and weekend farmers markets are part of the rhythm. Over the past five years, East Dallas has seen steady growth—home prices surged during the 2020–2022 boom, then cooled slightly as rates climbed, but demand never disappeared. Buyers are drawn to the area’s walkability, proximity to downtown, and undeniable charm. In 2025, it remains one of the most authentic and consistently desirable parts of the city.
Strengths
- Large, diversified buyer pool
- Good transactional scale
Limiters
- Competitive pressure has fallen meaningfully
- Over-ask rate down double digits
- Sales slowing (DOM ~48 days)

Data Summary
- Market posture: Somewhat competitive
- Redfin Compete Score: 50
- Average days to pending: ~52 days
- Hot homes: ~25 days, around list price
- Sale-to-list price ratio: 96.7% (-1.1 pts YoY)
- Homes selling above list: 9.1% (-10.4 pts YoY)
- Median days on market: ~48 days (+8 days YoY)
Lake Highlands
Lake Highlands has built its reputation on strong schools, tight-knit community vibes, and a prime location just northeast of White Rock Lake. With its mid-century homes and tree-lined streets, it feels like a small town tucked inside the city. The real estate market here surged during the pandemic and then leveled out—but unlike some areas, prices didn’t slide. Demand is still strong, inventory stays tight, and updated homes in the sweet spot price range tend to get snapped up fast. It’s a solid, consistent neighborhood with long-term appeal.
Strengths
- Affordability-driven demand
- Highest % of homes selling over list (15%), albeit declining
- Solid buyer depth
Limiters
- DOM rising sharply (+16–19 days YoY)
- Price appreciation flattening
- Competitive intensity cooling quickly

Data Summary
- Market posture: Somewhat competitive
- Redfin Compete Score: 46
- Average days to pending: ~60 days
- Hot homes: ~20 days, around list price
- Sale-to-list price ratio: 96.8% (-0.82 pts YoY)
- Homes selling above list: 15.0% (-9.32 pts YoY)
- Homes Sold: 188 vs 196 last year (≈ -4% YoY)
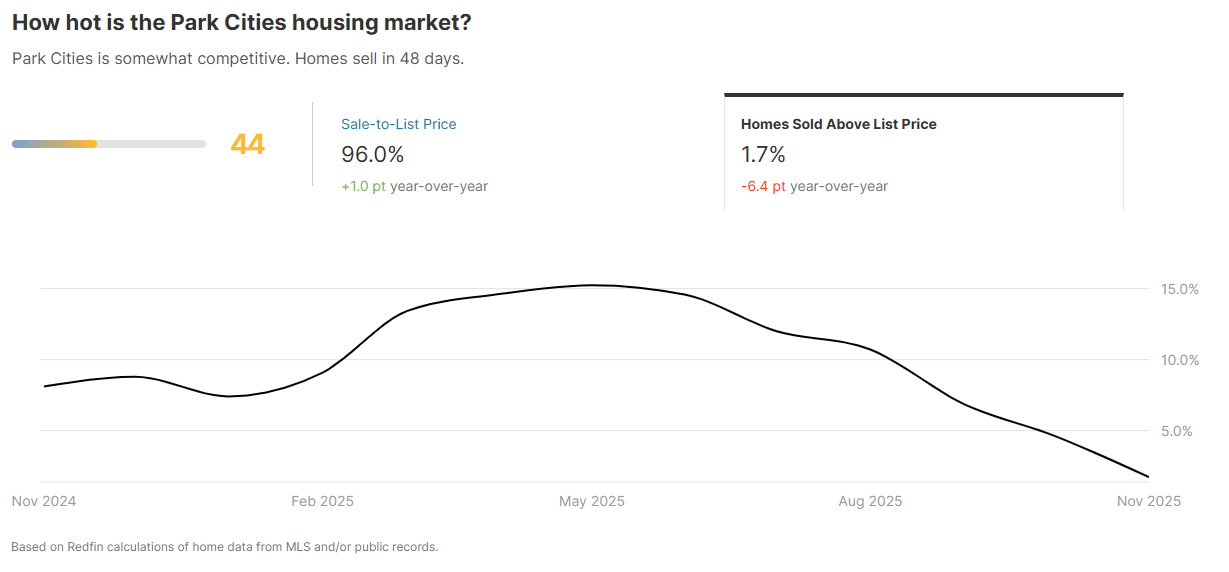
The Park Cities
Lake Highlands has built its reputation on strong schools, tight-knit community vibes, and a prime location just northeast of White Rock Lake. With its mid-century homes and tree-lined streets, it feels like a small town tucked inside the city. The real estate market here surged during the pandemic and then leveled out—but unlike some areas, prices didn’t slide. Demand is still strong, inventory stays tight, and updated homes in the sweet spot price range tend to get snapped up fast. It’s a solid, consistent neighborhood with long-term appeal.
Strengths
- Strong headline price growth
- Blue-chip location
- Long-term value retention
Limiters
- Extremely low over-ask activity (1.7%)
- Volume down >20% YoY
- Below-list execution is the norm
- Inventory tightening
Data Summary
- Market posture: Somewhat competitive
- Redfin Compete Score: 44
- Average days to pending: ~48 days
- Hot homes: ~26 days, ~1% below list
- Sale-to-list price ratio: 96.0% (+1.0 pt YoY)
- Median sale price: ~$2.97M (+21.3% YoY per metric tile)
- Median days on market: ~55 days (+11 days YoY)
- Homes sold (Nov): 58 (-21.6% YoY based on previous November)
The Biggest Loser
Preston Hollow
Preston Hollow is one of Dallas’s most iconic neighborhoods—known for its wide, tree-lined streets, sprawling estates, and an unmistakable air of old-school prestige. It’s home to some of the city’s most notable names and sits close to top-tier private schools, high-end shopping, and major business hubs. Over the past several years, the market here has stayed strong and steady. Even when things cooled off elsewhere, demand in Preston Hollow never really slowed—especially for well-maintained or custom-built homes. It’s still the go-to spot for buyers looking for space, privacy, and luxury with a central Dallas address.
Why it loses:
- Slowest sale rate (81 DOM)
- Weak sale-to-list ratio (95.3%)
- Declining over-ask activity

Data Summary
- Market posture: Somewhat competitive
- Redfin Compete Score: 34
- Median sale price: ~$2.5M (+11.8% YoY compared to November 2024)
- Sale-to-list price ratio: 95.3% (-1.0 pt YoY)
- Homes selling above list: 7.1% (-5.4 pts YoY)
- Hot homes: ~37 days, ~2% below list
Autor Comments
Although the data may not look like what you had hoped for you neighborhood, depending on where you live in town, keep in mind: your home may not be the same depending on how it aligns with the market that transacted in 2025. These numbers and graphs are all meant to simply give you an idea of the market trajectory as we head into 2026. If you woulld like a more solid estimate of your home's value, you can fill out the home report request below and I will create a custom housing value report for your property. (bear in mind: the report will send an auto report immediately with auto valuation models that may or may not be accurate; I will provide you a hand made broker opinion within 24-36 hours. Thank you!!)

More from the blog
Explore recent articles about Dallas real estate

Buying your first home
Navigate the complex world of first-time homeownership
Dallas neighborhood spotlight
Discover the unique character of Dallas neighborhoods

Investment strategies for Dallas real estate
Smart approaches to property investment in Texas